Use FengSui
Dashboard
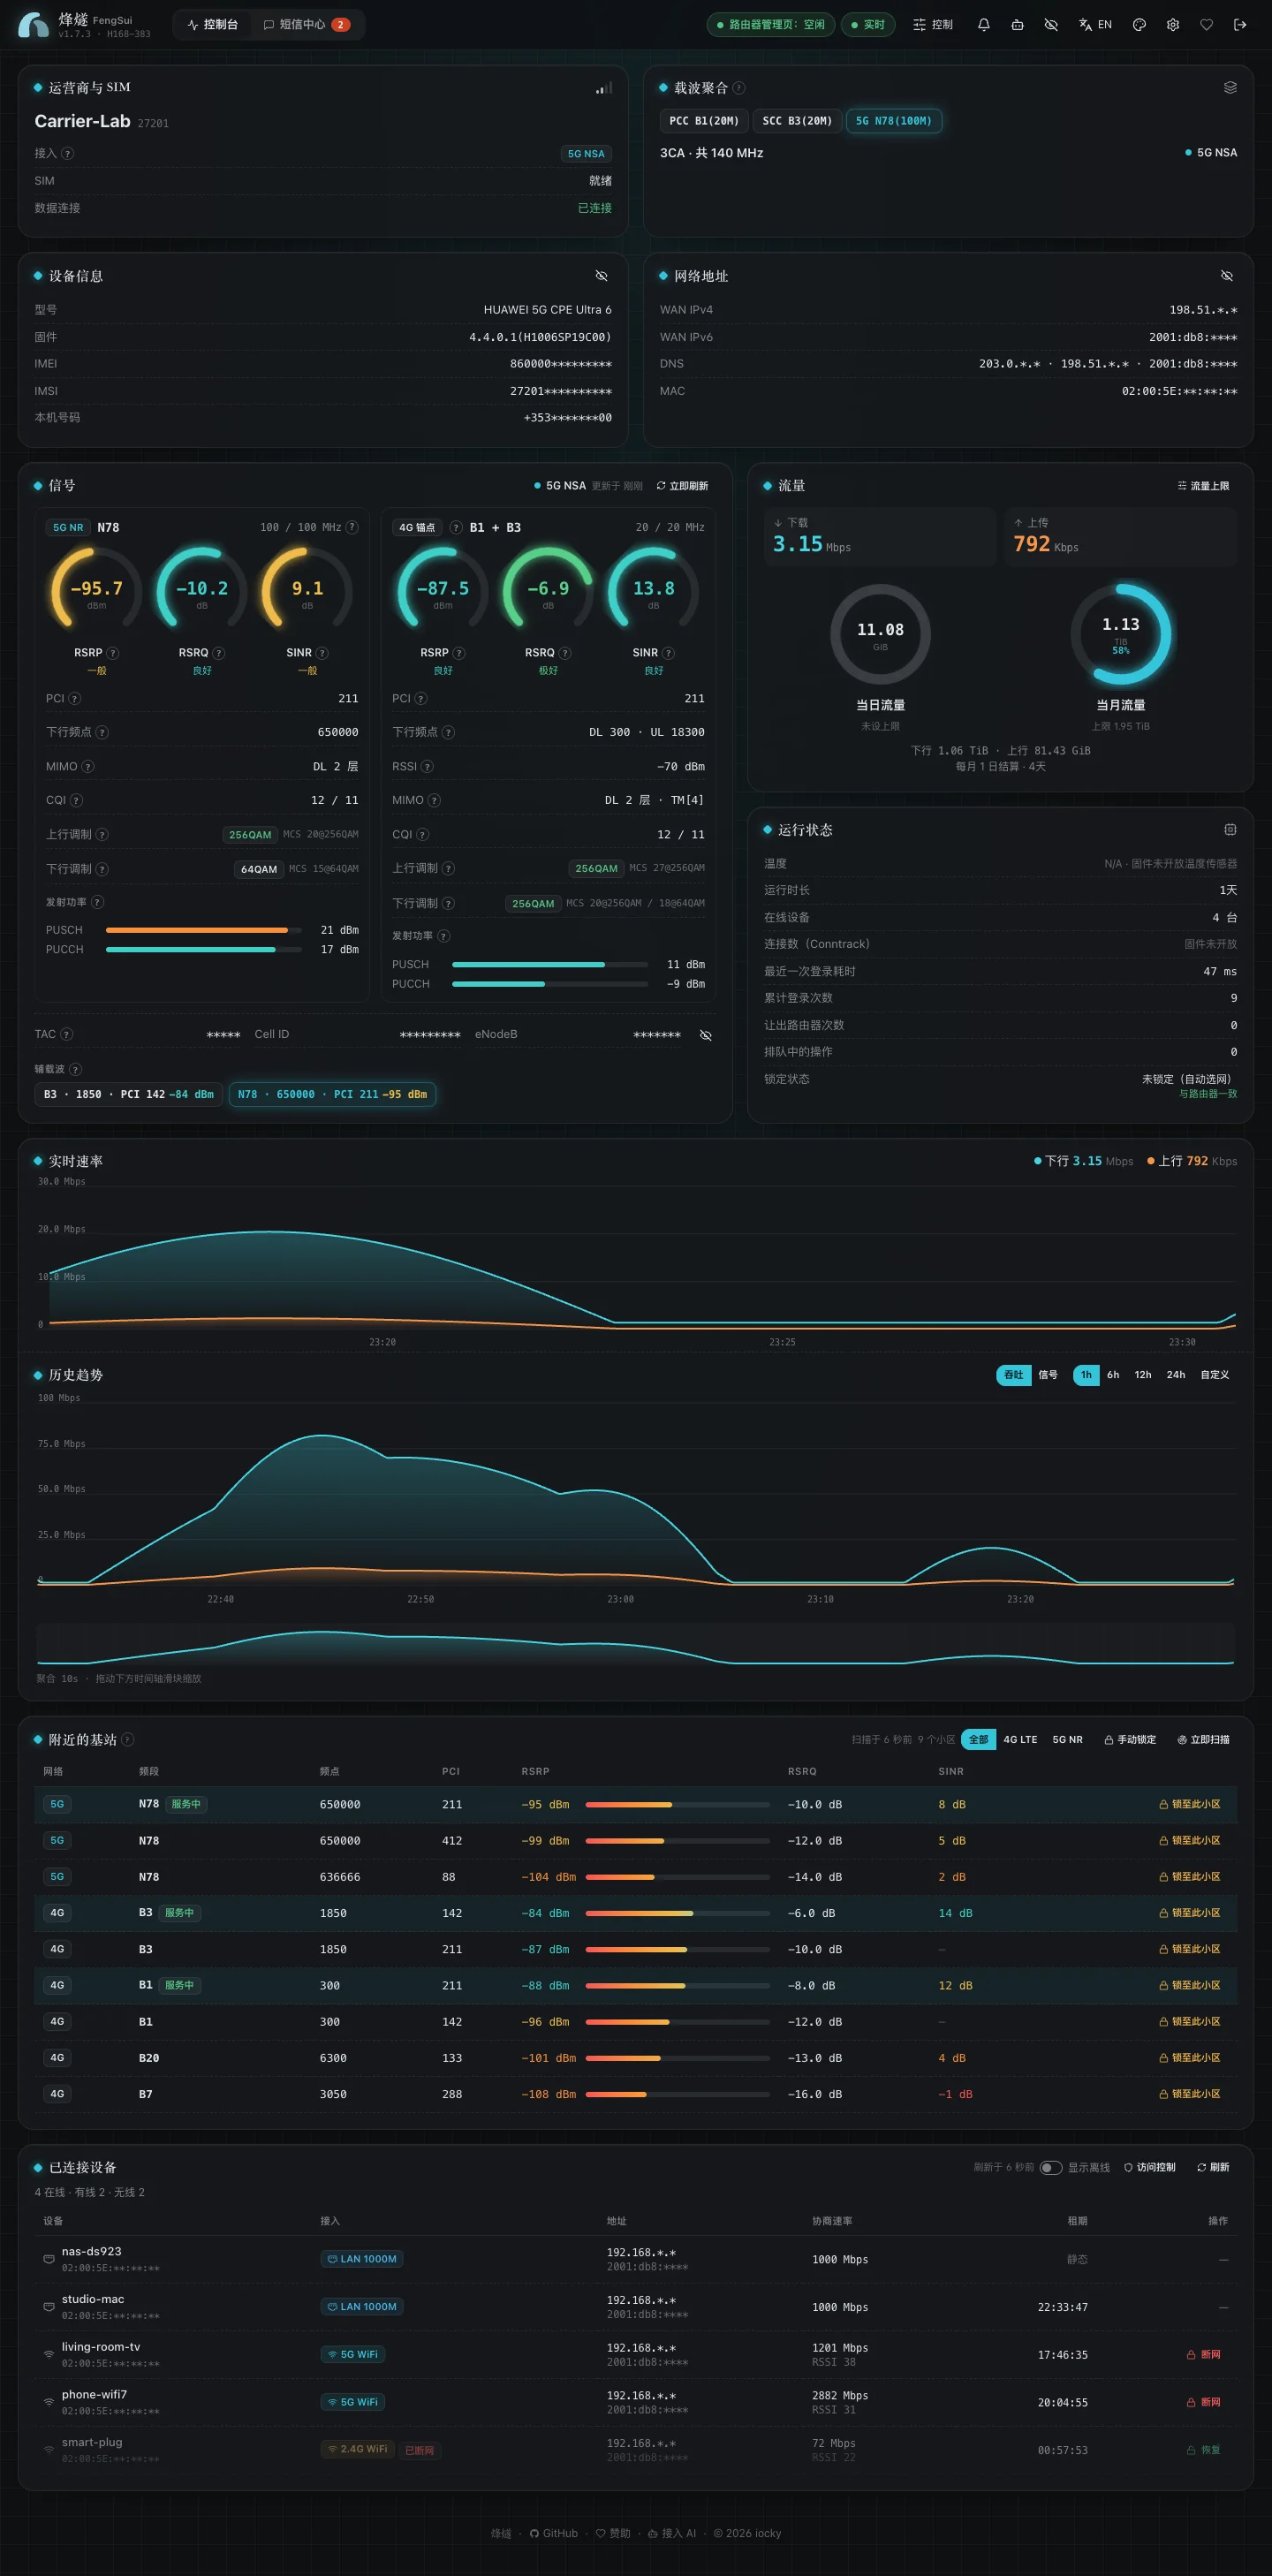
What each section on the Dashboard shows: Signal, Carrier aggregation, Nearby cells, Data usage, Connected devices, and historical charts.
When you log in, you see the Dashboard. Data refreshes every 5 seconds. When reading the router, FengSui stays logged in for only a few dozen to a few hundred milliseconds and logs out immediately, so you can log into the router's own web page at any time.
Header
- Operator & SIM: operator name, SIM status, and access mode (4G, 5G NSA, 5G SA).
- Device: model, firmware, and masked IMEI, IMSI, and phone number. Click the eye icon to reveal the values when needed; they stay masked by default for safe screenshots.
- Network addresses: IPv4, IPv6, and DNS addresses assigned by the operator network, also masked by default.
- Router admin page status: "free" means everything is normal; "Someone is using the router's admin page · paused" means someone signed in to the router's own web page and FengSui waits for them to sign out; "Router rejected the password · logins stopped" means you need to correct the password under Settings → Router.
- Alert bell: recent alerts.
Hover over any term with a <kbd>?</kbd> to see a short explanation, or click it for detailed notes. If you do not need them, turn them off under Settings → Appearance.
Carrier aggregation
Lists every carrier the router is currently using together, such as B1(20M) + B3(20M) + n78(100M). More carriers and wider bandwidth provide higher peak speeds. To learn what these notations mean, see Bands, carriers, and cells.
Signal
Split into 5G and 4G sections, this card shows signal strength, quality, modulation, transmit power, and other metrics. To learn what each number means, what counts as good, and what to do when the signal is poor, see Understand signal readings.
The three most important numbers are RSRP (signal strength), RSRQ (signal quality), and SINR (signal purity). Ring colors indicate rating levels from good to poor. Cell identifiers (TAC, Cell ID, eNodeB) are masked by default.
Nearby cells
Lists neighboring cells the router detects, sorted by signal strength. The cell labeled "Serving" is the active one. You can click "Lock to this cell" on any row; see Lock bands and cells. The table refreshes every minute, or you can click "Scan now" to scan immediately.
Data usage
- Real-time rates: upload and download rate curves.
- Daily and monthly usage: two gauge rings. Click "Usage caps" to set a monthly data cap; the ring changes color and triggers an alert when exceeded. The billing day follows the router's setting.
Status
Uptime, number of connected devices, response time of the last read from the router, and lock status. FengSui checks whether the locks on the router match what it applied; if they differ, it displays "differs from router".
Historical charts
View rate and signal trends for the last 1, 6, 12, or 24 hours, or a custom time range. Drag the brush bar at the bottom to zoom into a specific period. Data points sampled every 5 seconds are kept for 3 hours, then aggregated by minute and kept for 7 days.
Connected devices
Lists devices connected to the router: device name, connection type (wired or 2.4G/5G Wi-Fi), IP address, link speed, and DHCP lease duration. Wi-Fi devices feature "Block / Restore" buttons. For more management options, see Manage devices and access.
Appearance
Switch between Chinese and English and choose a theme in the top right corner. FengSui includes 14 themes (7 light and 7 dark). When following the system appearance, you can pick separate themes for day and night, or create a custom theme using three colors. Preferences are saved only in your browser.